From the
point of view of forecasting, (that is, if I want to know the amount of memory
I have to put on one server, or if the actual memory of a server will be enough
for the current workload), I have taken this approach:
Really, I
do not care about the current size of shared segments in memory. This is
because I do not want parts of my SGA to be swapped to disk whenever possible,
so I will always count for my instance the SGA size as a memory requirement.
Regarding
to the libraries and processes, will check th sizes according to the points
previously commented:
For
processes:
(including
background processes)
for i in `ps -fu oracle | grep
-v grep | grep -v PID | awk '{print $2}'`; do cat /proc/$i/smaps |sed '1 i\1' |
while read line; do awk '$2~/w/
&& $2!~/s/ {x=NR+2;next}(NR<=x){print}'; done | grep Rss | awk
'{v+=$2} END{print v}'; done | awk '{total+=$1} END{print total}'
For server
processes only, modify "`ps -fu oracle | grep -v grep | grep -v PID"
according to the needs. Remember that for local clients, have to count both the
server process as the client itself!.
For
libraries:
for i in `ps -fu oracle |
grep -v grep | grep -v PID | awk '{print $2}'`; do cat /proc/$i/smaps |sed '1
i\1' | while read line; do awk '($6~/ld/
|| /lib/ || /oracle/) && ($2!~/w/) {x=NR+2;next}(NR<=x){print}';
done | grep Rss | awk '{v+=$2} END{print v}'; done | sort -n
Take the
last value (biggest). Modify as needed, as done with the processes command.
The total
of memory allocated would be aproximately: SGA memory + total processes +
libraries (only last value).
As I have
said before, the RSS of processes changes along time. More, Linux proactively
pages out pages that have not been used for some time, (more or less
intensively depending of the memory needs), so a process that shows a RSS of
5MB in one moment, could show 3MB later (as an example). So, to get the more
accurate picture , we need to take many snapshots of the memory consumption along a period, to see
what is the maximum.
Red Hat
suggested me to take a different approach and use a value included in the newer
versions called Pss (Proportional Set Size), but I have seen that this value
counts also the shared segments, so would not be useful if we want to do the
calculations for server processes. In my tests, my approach gave a good guess,
although I am sure that can be improved.
SO, WHAT NOW?
Actually,
the memory in Unix systems is a kind of black box. It is very difficult to get
a good view on what is it really doing. I have based my approach from a purely
experimental point of view, so perhaps my results are not as accurate as should
be, but they can do the job from a more practical point of view,
I did my
research in both real as simulated systems. I was lucky enough to find three systems with the behaviour I
needed. One, working smoothly with a lot of resources free, a second one just
on the edge and a third one with a lot of memory pressure (actually, sometimes
the OOM Killer kills an instance. Luckily is a development system!)
Here are
the graphics with the behaviour.
SYSTEM RUNNING SMOOTHLY:


ON THE EDGE:


MEMORY PRESSURE


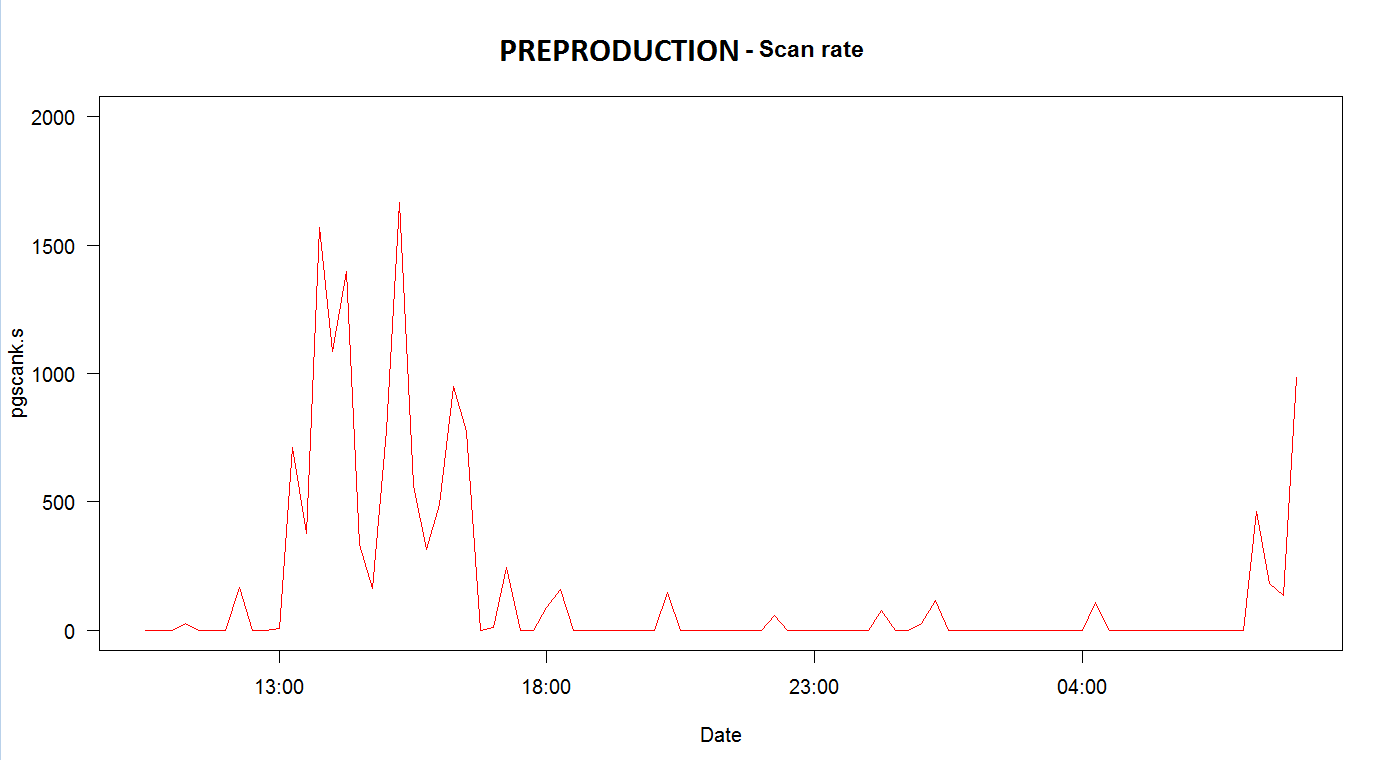
As can be
seen, a continuous activity of the memory scanner is a good indicator of
something going wrong. (not exactly fresh news!:... ), But we should take into
account more values to get a more clear picture about the situation, also we should
keep in mind that we can change the behaviour of the memory scanner (example,
raising the value for /proc/sys/vm/min_free_kbytes), so it starts before.
Let's make
a long history short. By default, Linux will try to use all the physical memory
available, although this does not implies that is busy all the time. Actually,
a lot of it will be freeable. So, Linux will take memory from both free as
cached memory.
Once the
free memory arrives to a value, ( low memory limit of the zone defined in
/proc/zoneinfo), the kswapd process will start to scan for pages that can be
sent to swap. And the system will start to use swap. This is not a bad thing
neither means that the system is under memory pressure. Linux practively will
swap pages of memory that have not been accessed for a long time. (this
behaviour can be tuned by some kernel parameters). So, even if we see that the
system has some swap used, is not a something to worry about. As said, we need
a better picture.
If the
processes keep taking memory and swap arrives to the limits, Linux will keep
trying to liberate memory, but once the free memory is under the limit defined
by the parameter "min", the Linux OOM Killer process will kill the
selected process (also can be influenced by parameters). Here we have an
example:
Sep 1 09:52:32 prevdbp04 kernel:
lowmem_reserve[]: 0 575 575 575
Sep 1 09:52:32 prevdbp04 kernel: Node 0 DMA32
free:3016kB min:3028kB low:3784kB high:4540kB active_anon:260860kB
inactive_anon:261176kB active_file:52kB inactive_file:568kB unevictable:0kB
isolated(anon):0kB
isolated(file):0kB present:589776kB mlocked:0kB dirty:0kB writeback:0kB
mapped:216kB shmem:0kB slab_reclaimable:6044kB slab_unreclaimable:22548kB
kernel_stack:872kB paget
ables:5960kB unstable:0kB
bounce:0kB writeback_tmp:0kB pages_scanned:533 all_unreclaimable? yes
Sep 1 09:52:32 prevdbp04 kernel:
lowmem_reserve[]: 0 0 0 0
Sep 1 09:52:32 prevdbp04 kernel: Node 0 DMA:
1*4kB 1*8kB 2*16kB 1*32kB 0*64kB 2*128kB 0*256kB 0*512kB 0*1024kB 1*2048kB
0*4096kB = 2380kB
Sep 1 09:52:32 prevdbp04 kernel: Node 0 DMA32:
74*4kB 18*8kB 5*16kB 2*32kB 2*64kB 0*128kB 1*256kB 0*512kB 0*1024kB 1*2048kB
0*4096kB = 3016kB
Sep 1 09:52:32 prevdbp04 kernel: 1147 total
pagecache pages
Sep 1 09:52:32 prevdbp04 kernel: 962 pages in
swap cache
Sep 1 09:52:32 prevdbp04 kernel: Swap cache
stats: add 299135, delete 298173, find 4816/5271
Sep 1 09:52:32 prevdbp04 kernel: Free swap = 0kB
Sep 1 09:52:32 prevdbp04 kernel: Total swap =
511992kB
Sep 1 09:52:32 prevdbp04 kernel: 153583 pages RAM
Sep 1 09:52:32 prevdbp04 kernel: 5968 pages
reserved
Sep 1 09:52:32 prevdbp04 kernel: 456 pages shared
As we can
see, the Free Swap is 0 and the total free space in zone DMA32 (under 4 GB) is
3016kB. The min value for this zone is 3028kB and, as there is not more
freeable memory, the OOM process acts.
No hay comentarios:
Publicar un comentario